Cities · CityTwin
Ask the city. Check the answer.
CityTwin builds a model of a city from the documents, open data and maps it already has, and answers questions from that model. Every answer names its sources and says what the data cannot support.
Who it is for
For the people who plan and run a city.
City administrations, planning and mobility departments, and the teams preparing funding files. The master plan, the mobility plan, the budget and the map layers all exist, but nobody can question them together before a decision. CityTwin makes that possible without sensors, 3D models or a large technical team.
What it does
Six things it does today.
- 01
Ask the city
Questions in plain language, answered on the map. Each answer carries its sources, its assumptions, the gaps in the data and a confidence level.
Implemented - 02
Simulate an intervention
Eight intervention types, from a transit stop to a green space, with walking catchments on the real street network, placement checks, and two scenarios compared side by side.
Implemented - 03
Heat-risk screening
Every neighbourhood scored on mineral against green land cover, with the population and services exposed. It is a screening, and is labelled as one.
Implemented - 04
Live city signals
Current weather, air quality and local particulate sensors, refreshed continuously and kept as a series.
Implemented - 05
Open data, one step
The full city model, its schema and the data licences can be downloaded from inside the platform.
Implemented - 06
Decision report
A print-ready report with a map snapshot, indicators, problems, projects, and the answer and simulation from the session attached.
Implemented
Worked model · Brașov, Romania · public records
What a city looks like once it has been modelled.
- 15
- neighbourhoods, with their real boundaries
- 73.7%
- impervious surface in the historic centre in 2021, the highest of the fifteen
- 11.1 °C
- spread in surface temperature between neighbourhoods, on one satellite pass
- 65.3 ha
- newly sealed between 2018 and 2021, inside the fifteen neighbourhoods
Where each figure comes from
- 15
- WhatNeighbourhoods that have a boundary in the model. SourceOpenStreetMap, neighbourhood boundaries, under the Open Database Licence. LimitA neighbourhood without a mapped boundary is not among them. The boundaries are not the units of the city's urban plan.
- 73.7%
- WhatShare of the surface of the historic centre that is impervious. Unit: per cent of area. SourceCopernicus Land Monitoring Service, Imperviousness Density 2021, 10 metre resolution. Retrieved on 2 August 2026. MethodThe mean of the pixel values, 0 to 100 per cent each, over the pixels inside the neighbourhood boundary, measured in an equal-area projection. Pixels without data are left out. LimitThe reference year is 2021. It describes land cover, not temperature.
- 11.1 °C
- WhatDifference between the warmest and the coolest neighbourhood averages of land surface temperature: 46.3 °C and 35.2 °C. The city average on the same pass was 40.5 °C. SourceLandsat 9, Collection 2 Level-2, surface temperature band, 30 metre resolution, published by USGS and NASA. One pass, on 29 June 2026 at 09:02 UTC, with 4.5 per cent cloud over the scene. MethodThe mean over the clear pixels inside each boundary. Cloud, cloud shadow, cirrus, snow and water are removed with the quality band of the scene. LimitIt is the temperature of the surface, such as asphalt, roofs and grass. It is not air temperature, and it is one late-morning pass, not a summer average. The smallest neighbourhood has 541 clear pixels.
- 65.3 ha
- WhatArea newly sealed between 2018 and 2021. Unit: hectares. No area was unsealed in the same period. SourceCopernicus Land Monitoring Service, Imperviousness Density Change 2018-2021, 20 metre resolution. Retrieved on 2 August 2026. MethodThe change values of the Copernicus product are summed over the pixels inside each boundary. One pixel covers 400 square metres. It is the product built for change, not our own subtraction of two yearly layers. CheckNewly sealed 65.26 ha, unsealed 0.0 ha, net change 65.26 ha: the sum of the fifteen neighbourhood values in the data file. Newly sealed area and net change are different quantities. They are equal here only because nothing was unsealed. LimitIt covers the fifteen neighbourhoods, not the whole administrative territory. The latest reference year is 2021, so later change is not in it.
The values behind the four figures are published per neighbourhood, with the Copernicus and Landsat products used, the period, the territory, the method and the units: the Brașov figures, data file. The export of the public demonstration is a reduced one: it carries the imperviousness layer behind the 73.7 per cent, and it does not carry the sealing layer or the surface temperature layer. The public export (opens in a new tab). The model is assembled from public documents and open data. It is not an official municipal system.
The product, on the Brașov model
From a question about heat to a map somebody can check.
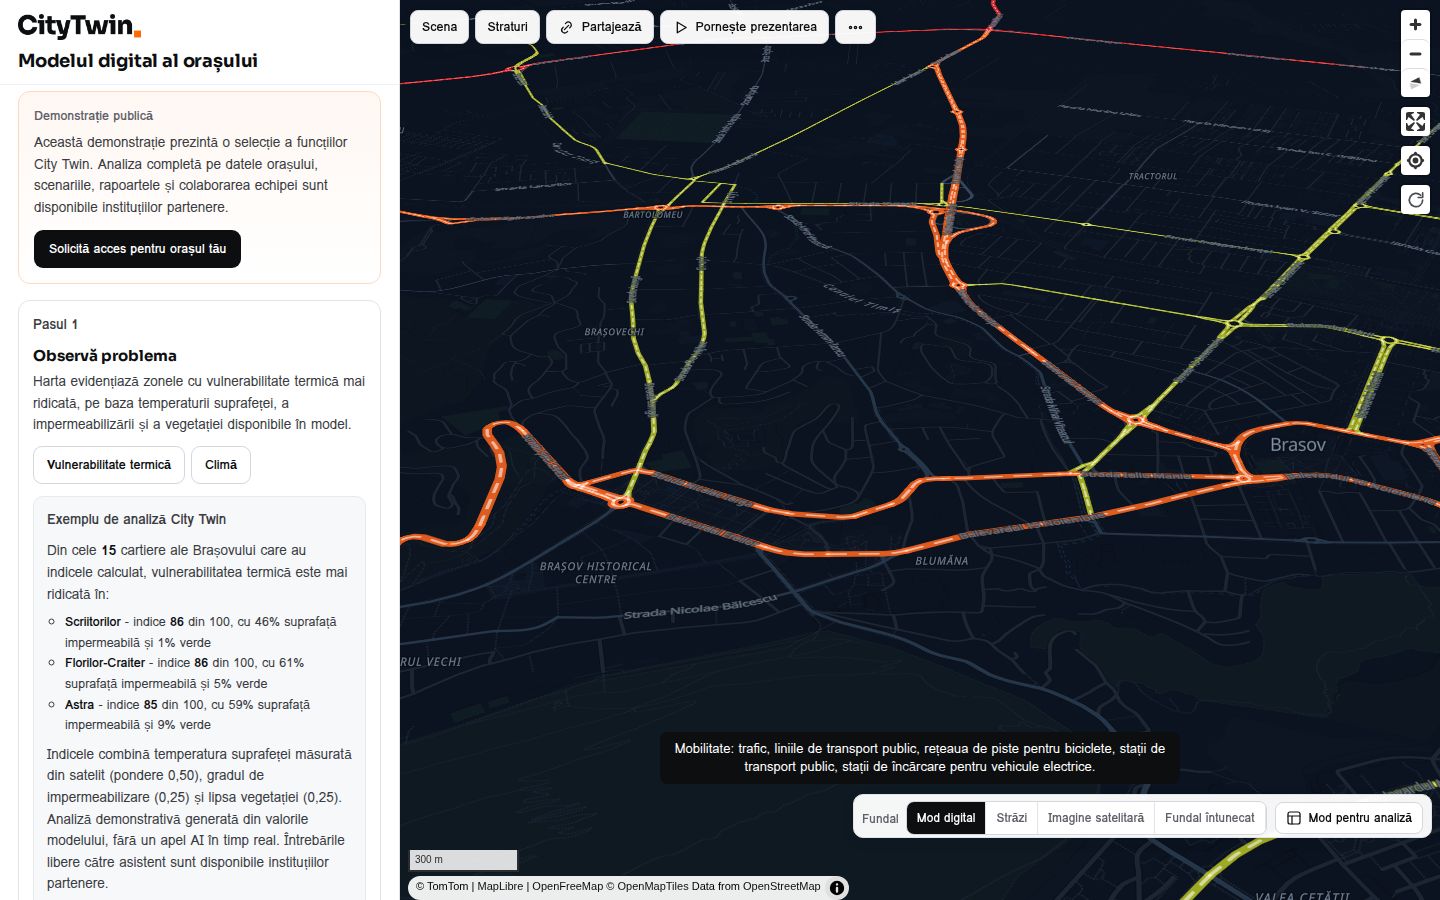
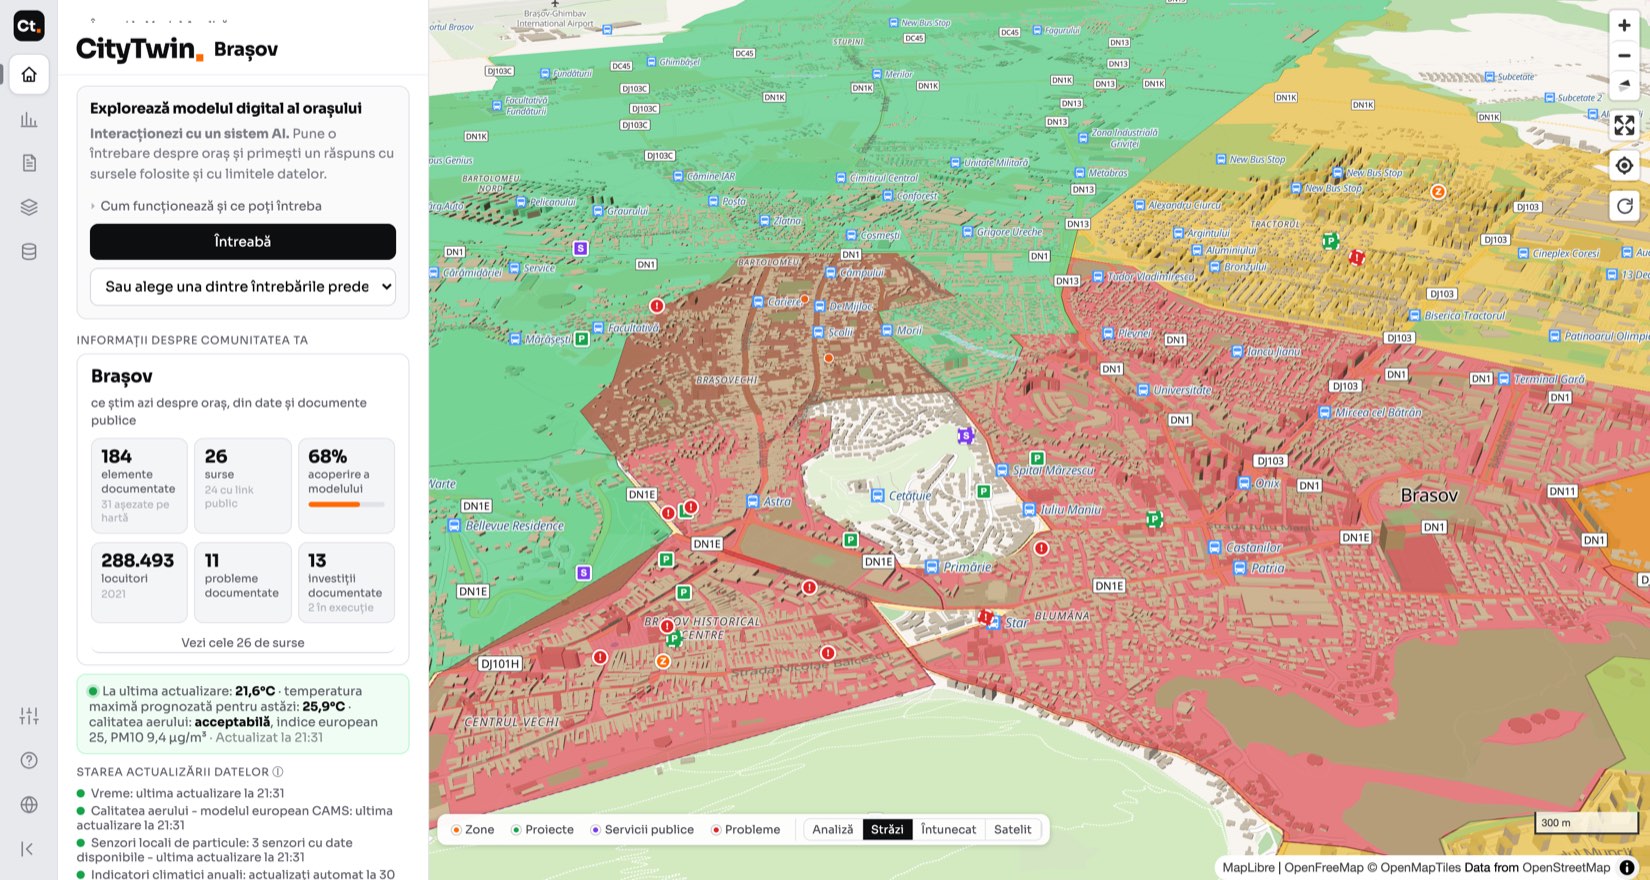
The problem
A planning department has to say which neighbourhoods are most exposed to heat, and be able to show why.
The screen
Neighbourhoods coloured by class on the city map, next to what the model holds: documented elements, the number of sources, and how much of the model is covered.
What the user does
Asks a question in plain language or picks a prepared one, switches thematic views, and opens the list of sources behind the answer.
The result, and its limits
An answer with its sources and a map to check it against. The index is a screening on land cover and satellite temperature and does not replace a measurement on the ground. In the public demonstration this analysis is generated from the values in the model, without a live call to an AI model. Free questions to the assistant are part of a city's own deployment.
In daily work
From scattered documents to a question you can ask.
- 01
Collect
Public documents, open data and geographic sources are connected. It is not a migration project.
- 02
Model
The city becomes zones, projects, problems, services and indicators, each with its source.
- 03
Ask
Staff ask questions and get answers from the model, with gaps declared instead of filled.
- 04
Decide
Scenarios are compared on the map and the result leaves as a report for the meeting or the funding file.
Data and integrations
What it needs in order to work.
Results and limits
What you get, and where it stops.
What you get
- Answers that can be checked against the documents they came from
- Scenarios compared before money is committed
- A report ready for the council meeting or the funding file
- A city model the administration can download and keep
Limits
- It is not an enterprise digital twin: no real-time control of infrastructure
- It answers from what is in the model. A document that was never provided cannot be cited
- Heat risk is a screening, not a physical simulation
- Map layers from open sources keep their own licences and their own accuracy
What is real on this page
Implemented means the function exists and runs in the product. It does not mean it has been validated in a customer's operation. Where something is a prototype, a demonstration on synthetic data, an integration done at the customer or a direction of development, it is labelled as such.
The working model of Brașov, Romania, is assembled from public documents and open data. The four figures above come from it, and the values behind them are published per neighbourhood, with source, method and limits. Sources and method. It is not an official municipal system.
A model for another city is built from that city's own documents during implementation. Nothing on this page describes a city that has not been modelled.
Start an evaluation
Name a city and the decision in front of it.
We show you the working model, then tell you what a model of your city would hold, what it could answer and what it would still not know.
The evaluation uses the Brașov model and public data. Your documents are only used once a deployment is agreed.