Territories · TerraScan
Territorial risk, read from satellite data.
TerraScan turns open European earth observation into a risk score for every administrative unit, with reports and alerts written for the people who have to act on them.
Public demonstration · Romania, county by county · fire on real data
Who it is for
For those who answer for a territory.
Local and county administrations, emergency services and forest managers. European satellite data is open and continuous, but it arrives as scenes and spectral bands. Almost nobody turns it into something an administration can act on. TerraScan does that work once, for every unit, on the same data.
What it does
Four risk modules on one pipeline.
- 01
Fire
Fire weather, vegetation dryness, drought, active hotspots and what is exposed around them.
Implemented - 02
Air
Air quality and the exposure of the people inside the affected area.
Implemented - 03
Vegetation
Vegetation health, water stress and drought, followed as a series.
Implemented - 04
Water
Water-related risk for each territory, scored on the same scale as the others.
Implemented - 05
Composite score
One figure from 0 to 100 per territory, in classes, that opens into the indicators behind it and the share of the largest ones.
Implemented - 06
Reports and alerts
Executive reports in administrative language, downloadable, and rules that raise an alert when a threshold is crossed.
Implemented
Implemented describes the function. The data behind the public demonstration differs by module: fire runs on real data, while air, vegetation and water run on indicative data. What is real on this page
The product, in its public demonstration
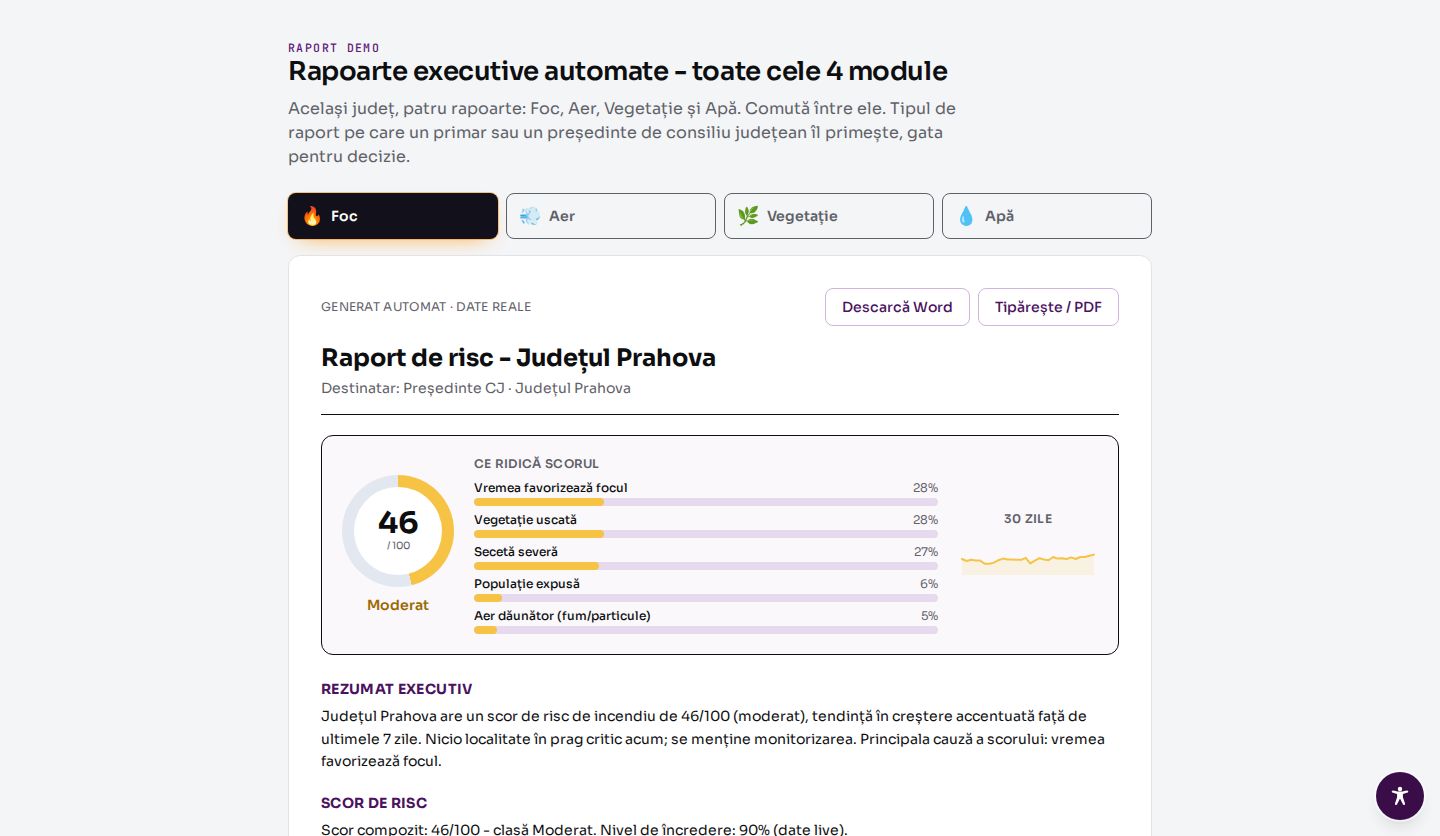
Why this county scores 46.
A manager asks why one territory ranks above its neighbour. The report opens the score into the indicators that produced it, and shows the share of the five largest.
What the user does
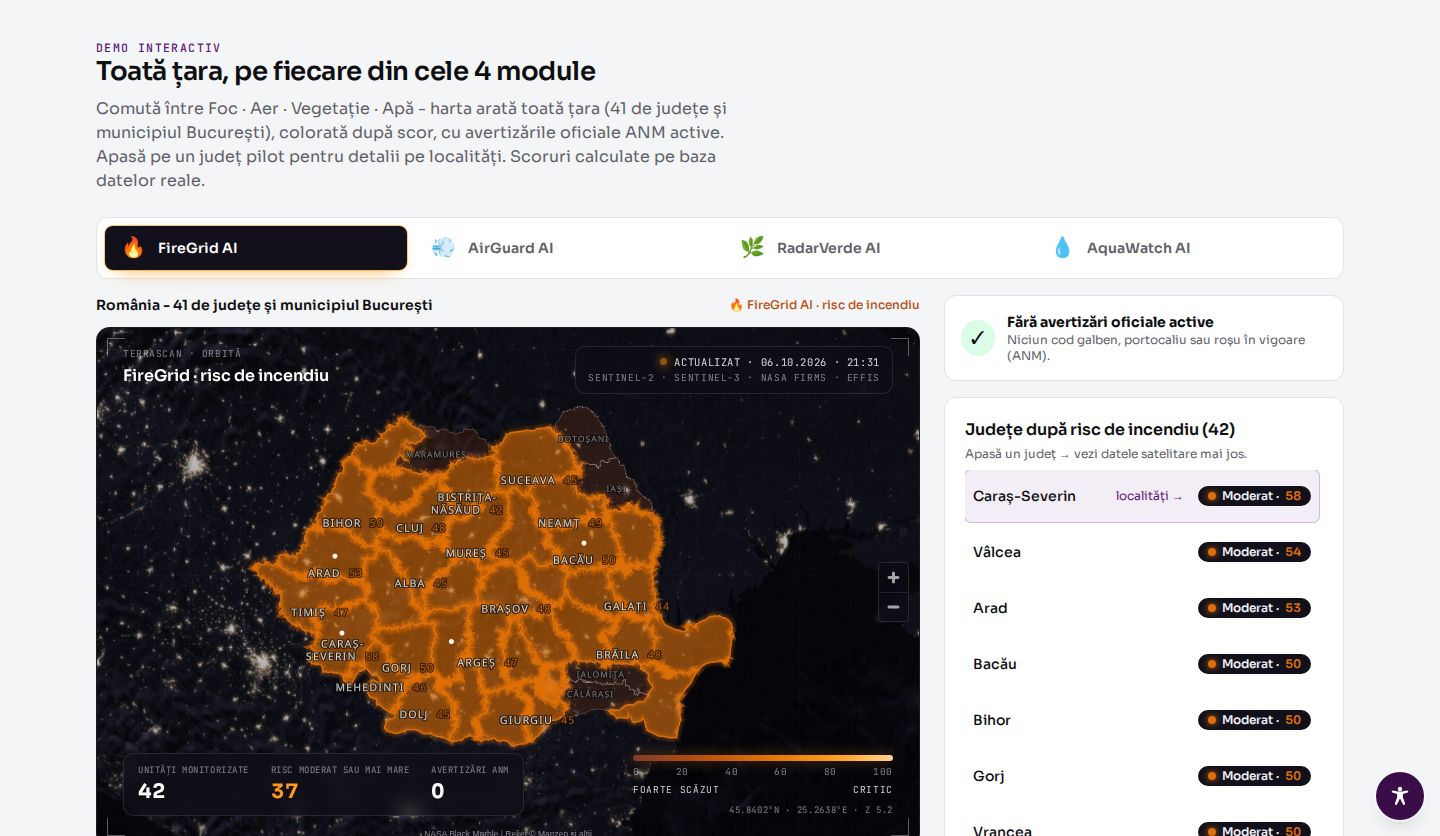
Switches between the four modules, opens a county, reads which indicators carry the score and compares it with another county. The report can be downloaded as a document from the demonstration report (opens in a new tab).
The result, and its limits
A ranking of where to look first, with the reason attached. The score orders territories for attention. It does not predict a specific event, and detail below county level is shown for a limited set of counties.
In daily work
From a satellite pass to a line in a report.
- 01
Collect
Optical, radar, thermal and atmospheric products, fire and emergency services, weather feeds.
- 02
Process
Indices and exposure are computed per administrative unit, not per satellite scene.
- 03
Score
Each unit gets its figure and its class, with the components visible.
- 04
Report and alert
Staff read a summary, compare units and receive an alert when a rule fires.
Data and integrations
What it needs in order to work.
Results and limits
What you get, and where it stops.
What you get
- Units compared on one screen, on the same scale
- A score that traces back to its indicators
- Reports and funding justifications ready to edit
- Alerts on thresholds you set
Limits
- A risk score orders territories for attention. It does not predict a specific event
- Resolution and refresh depend on the satellite revisit and on the source
- Outside Europe the land monitoring layers it relies on are not available
- It does not replace national warning services
What is real on this page
Implemented means the function exists and runs in the product. It does not mean it has been validated in a customer's operation.
The four modules, the composite score, the reports and the alerts exist and run in the product. That says nothing about which data a given demonstration report runs on. The data is stated separately, module by module, below.
Real data
In the public demonstration the fire report is labelled as generated on real data, with a confidence level of 90 to 95 per cent, the level the product gives to live inputs. The two screens on this page are the fire report and the fire view of the map.
Indicative data
In the public demonstration these three reports are labelled as generated on indicative data, with a confidence level of 55 per cent, the level the product gives to demonstration inputs. Their figures show how the report works. They do not describe the county.
The labels were read on the demonstration report on 7 October 2026. The demonstration can change, and each report states its own data and confidence level.
Detail per locality, accounts, alert rules and report recipients are configured for the territory of each deployment.
Start an evaluation
Name a territory and the risk you answer for.
We walk you through the public demonstration, then tell you what the pipeline would score for your territory, on which sources, and where coverage runs out.
The evaluation uses the public demonstration. Your own data is only used once a deployment is agreed.